We had such a favorable response to the boxing title last newsletter that we’re sticking with it today. And judging by May’s endorsement total, we may exhaust our limited stock of punchy phrases before we pick ourselves up off the mat.
May HECM endorsements came in at 5,188, down -15.3% from April but up 13.9% from last year. This is the second lowest level since December 2005, with only the recent trough of May 2010 registering a lower total. At this point the only question that seems fair is the same one we’re all asking of home prices: will there be a double dip?
Endorsement volumes are pointing downward again for the past two months, showing an eerie resemblance to the trend-line last year at this same time. We could draw a line through the dots and end up with nothing before Thanksgiving, which is downright scary.
That said, we need to look at application volumes (HECM case numbers issued to be specific) to really see whether our market is going to zero like a bad dotcom bubble stock.
The trend here is much more encouraging, although not without its challenges. We’ve been averaging just over 7,000 since October, but April’s total of 7,371 was the lowest over that 7 month period. Two key questions arise here, which we can deal with in turn.
Question 1: What does the application trend look like if we remove seasonal factors? We look at the application per business day trend year over year for this analysis, as it removes differences in business days and usually holidays (Easter is an exception falling in March and April, but was in April both this year and last).
The chart makes it more clear that much of the April decline in applications was due to fewer business days compared to March (21 vs. 24), although it also illustrates that we saw our first year over year decline in applications in the last 7 months. So while it’s probably safe to say we’re not going to fall off the bottom of the graph (at least this year), it does signal business plateauing at a low level, probably due at least in part to the exit of Bank of America and Financial Freedom.
The two lenders together were probably doing roughly 1,000 applications per month before exiting, so if we assume half of that volume has been picked up by other lenders it would mean slight growth year over year on this chart instead of the decline.
Question 2: What can applications tell us about the next few months for endorsements? We’ll go back to a modified version of the application/endorsements chart above, with endorsements lagged by 4 months to better align the two datasets.
The endorsement decline looks just as shocking here, but the blue line for applications shows it’s in the context of a much smaller decline in applications. We can also see that the pullthrough rate for applications in Oct-Nov was unusually high at 84% and 89%, respectively. We had previously chalked that up to spillover from September applications (where pullthrough was expectedly low at 48%), but the decline this month has us rethinking that.
In any event, we usually expect pullthrough to come in at 75-80% over the course of a few months based on historical experience, and May endorsements equate to 70% of Jan apps. It seems more likely that we’ll come back a bit given that applications were up in Feb-Mar and pullthrough may bounce back also.
So while the headline endorsement number is staggering and certainly tempers enthusiasm for the second half of the year, we’ll be paying more attention to the applications per business day and pullthrough trends to make sure these are one-time events and not the start of a negative trend.
A bit of housekeeping: As HUD changes their data reporting in the wake of broker licensing changes, please note that brokers not closing loans in their own name are rolling off the active lender list over the next few months. As such, we will not be emphasizing active lender counts and changes until this stabilizes, likely toward year end. After that transition is complete, Retail Leaders will reflect the number of lenders closing HECMs in their own name. For a report including brokered loan activity attributed to the broker, please see our Wholesale Leaders reports.
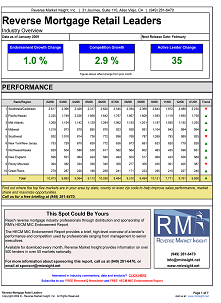
Click on the image below for this month’s report.


