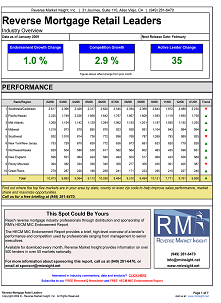
Retail HECM endorsements for December were virtually flat with November, down just -0.1% to 6,554 loans. That story isn’t much to write home about, but fortunately there’s a much bigger story hiding just below the surface. First though, let’s settle final 2010 numbers for those keeping track:
- 72,748 HECM Endorsements, down -35%
- 2,222 active lenders, down -28.9%
We’ve been talking all year about the decline in active lenders which has helped offset the dramatic volume declines in the industry, so it’s only fitting that we ended the year with an exclamation point on that particular theme. When looking at active lenders month by month (as we do in the Active Lenders graph on page 2 of the report below), we can see just how significant the decline has been.
December saw just 560 lenders endorse a HECM, down -47% from last December. We have to go all the way back to September 2006 to find a month with fewer lenders. That would only be good for cocktail party trivia at our next conference, except that it meant a dramatic rise in average loans per lender to 11.7. The last time we were higher was July 2007, which was probably also the last time lenders (at least the survivors) were sounding as optimistic as we’ve heard in the past few months.
Since the chart in our report only goes back 24 months, we thought we’d show a little more perspective with the chart below. Click the chart for a full size version.
It’s clear we’ve been spending a lot of time below the 10 units per month level these past few years, which happen to coincide with some pretty tough times for lenders. As a simple indicator of the health of our industry, we would suggest that over/under 10 loans per month is a good reflection of the general sentiment. Worth watching, and we conveniently provide it in this report at the beginning of each month!
Click on the image below for this month’s report.


