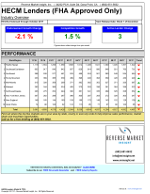
HECM endorsement volume gained fractionally in July, up 0.4% to 2,908 loans. This is the biggest sign yet that HECM volume may have bottomed following the substantial program changes that took effect Oct 2, 2017.
We usually profile different geographies and lenders in this space, but we have enough distance from the most recent principal limit (PL) reduction and rate floor change so we’re going to take a quick look at how this recovery from that event compares to past episodes to put it in context.
First and foremost, here’s the most important chart in our view for how to think about this.
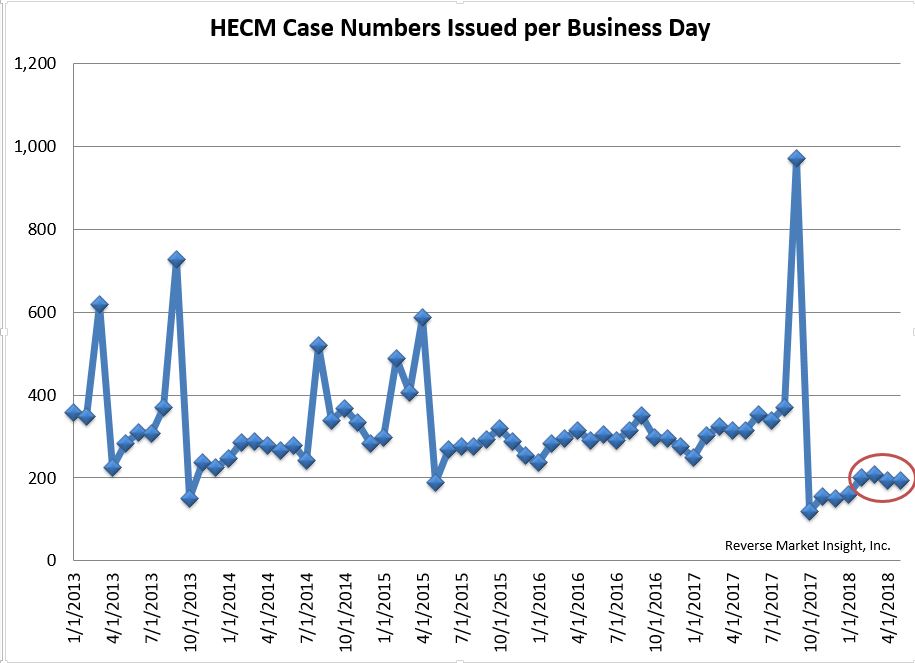
HECMs can’t be funded or endorsed (the volume we track in our 3 monthly reports) without first having a case number issued. And for all intents and purposes, we’ve seen a stall in the recovery of HECM cases being issued in the last four months (red circle on chart). That means we won’t see meaningful growth in endorsements for at least a few more months absent a significant change in how many cases become endorsed.
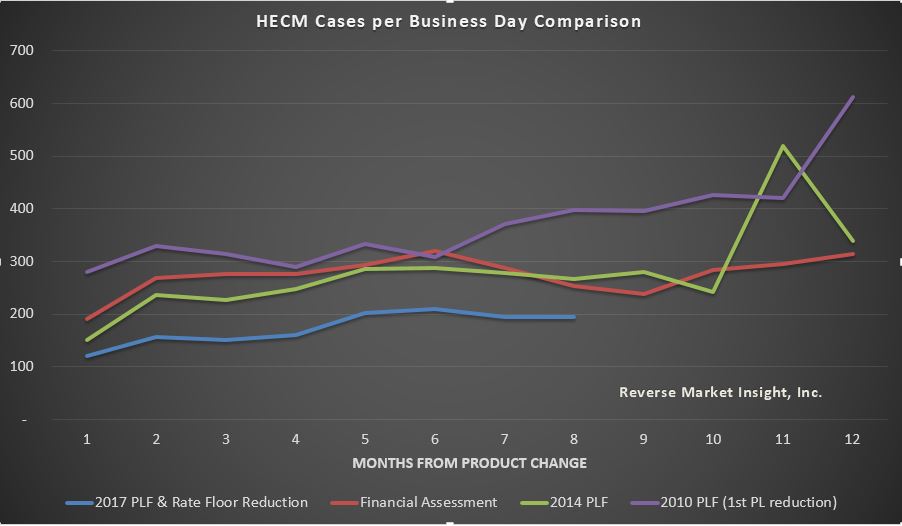
This second chart illustrates how the recovery so far compares to the 3 most significant prior changes in the HECM product. A few thoughts:
- Volume in the month after is lowest in the most recent change, which makes sense given it was both the largest change in the program’s history and came on the heels of other changes that cumulatively have reduced HECM volume over the years significantly
- Volume in the subsequent months is also the lowest of all 4 changes, although Financial Assessment and 2014 PLF had similarly slow recoveries from the starting point
- Volume for the most recent change has stabilized in Feb-May between 194 and 209 cases issued per business day
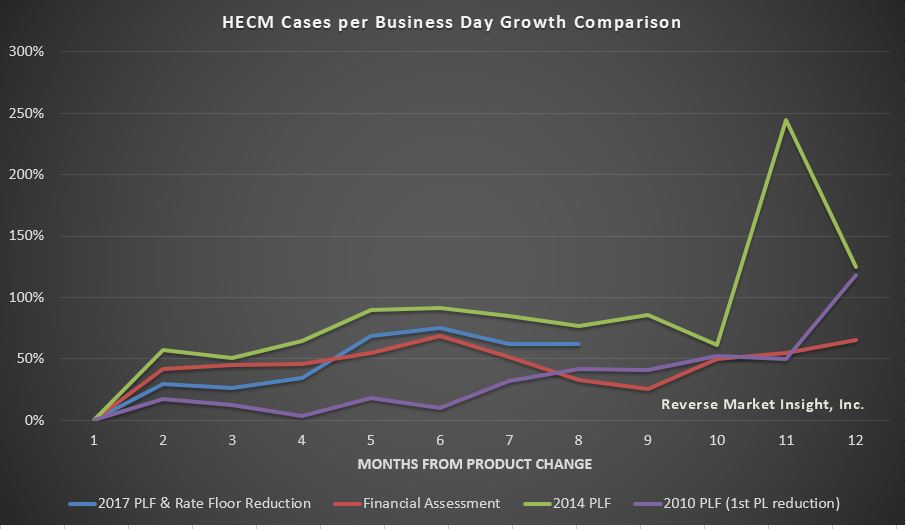
This last chart shows that on a comparative basis the most recent change looks somewhat better, as we’ve indexed the recovery against the starting low volume point for each change.
- This removes the effect of cumulative declines over time and solely compares the recoveries against each other
- It appears we’re on a similar recovery path in percentage terms to prior product changes, although not absolute volumes
So case numbers issued (applications) are probably in for tough sledding for a while yet if we go by prior product changes. Next time we’ll show how conversions of case numbers to endorsements look for this product change, then we’ll finish up this series with a look at some other factors causing turbulence in the industry from the most recent product change (namely loan size and high level revenue per loan).
If your company is FHA approved check out the rankings on page 5 of the report below. If your company is not FHA approved, watch out for our next edition of HECM Originators to find your ranking!
Click the image below for the full report.